
Measuring student retention with software analytics has shifted from a back-office reporting task into a core student success strategy. When institutions treat retention as a measurable, improvable outcome—supported by timely data—they can move from reactive “end-of-term” reviews to proactive, week-by-week support that keeps learners progressing.
At its best, student retention analytics connects three things that often sit in separate teams: (1) what students experience (courses, advising, billing, campus services, digital learning tools), (2) what students do (attendance, logins, submissions, interactions, appointments), and (3) what institutions change (interventions, policy, curriculum, and service design).
Software analytics helps you unify these signals into a consistent story: Who is persisting, who is drifting, why it’s happening, and which actions measurably improve retention.
This guide explains how to build reliable student retention analytics, choose the right metrics, design early-alert models responsibly, and operationalize insights across advising and instruction—without turning analytics into surveillance.
You’ll also see practical approaches for privacy, fairness, and future-facing trends like AI-enabled advising and real-time learning data standards. Throughout, you’ll find repeated, actionable references to student retention analytics—because clarity and consistency in language improves both execution and search visibility.
Why student retention analytics matters now

Student retention analytics matters because retention is rarely caused by a single event. Most students don’t “drop” overnight; they drift through a series of small frictions: confusing requirements, missed assignments, inconsistent attendance, financial holds, lower engagement in the learning platform, delayed support tickets, or a loss of belonging.
Measuring student retention with software analytics gives you a way to detect those friction patterns early—while there is still time to help.
Another reason student retention analytics is rising in priority is the growing expectation for evidence-based decisions. Leaders want to know which programs, instructors, course modalities, and services actually improve persistence.
Students and families also expect smoother digital experiences: intuitive portals, proactive communication, and fewer administrative barriers.
When analytics reveal that a particular registration workflow correlates with lower retention, the institution can fix the workflow instead of blaming student motivation.
Finally, there’s a technology shift. Modern learning environments generate high-volume behavioral signals—logins, clicks, submissions, discussion posts, video watch time, and tool usage—that can be standardized and analyzed.
Standards like Caliper Analytics are specifically designed to structure and exchange learning activity data at scale, so institutions can use it for decision-making and learner success.
Define retention in measurable, decision-ready terms
Student retention analytics fails most often at the first step: unclear definitions. “Retention” can mean first-to-second term persistence, fall-to-fall persistence, re-enrollment after stop-out, completion of credits on time, program progression, or credential completion.
If stakeholders use different meanings, your student retention analytics will produce conflicting results and mistrust.
Start with a decision-ready definition that matches how your institution acts. For example:
- Term-to-term persistence: student enrolls in the next academic term.
- Year-to-year retention: student enrolls in the next academic year (common for degree programs).
- Course retention: student remains enrolled through the add/drop period or finishes a course.
- Momentum retention: student completes a threshold (e.g., 12 credits per term) that predicts longer-term persistence.
Then define the unit of analysis (student, course, program), the cohort rules (first-time learners, transfer learners, part-time learners), and the time window (census date, end of term, rolling weeks).
Student retention analytics becomes far more useful when every chart can answer: What decision does this enable? For instance, if advisors need weekly prioritization, you should emphasize leading indicators (attendance, missing assignments) rather than only end-of-term outcomes.
Also define what does not count as attrition. Some students successfully transfer, take planned leave, or complete a short credential and stop by design. If you classify all “non-returners” as failures, student retention analytics will overstate risk and distort interventions.
A practical tip: document every retention definition in plain language, in a shared data glossary. This is the single highest-leverage move for long-term trust in student retention analytics.
Cohorts, baselines, and “retention math” that doesn’t lie
A retention rate is simple—until it isn’t. Student retention analytics needs careful cohort design to avoid misleading comparisons. A cohort should be stable and auditable: who is included, when they were counted, and why.
If one dashboard counts learners at “registration” and another at “census date,” you’ll get different retention rates and endless debate.
Build baselines at multiple levels:
- Institution baseline: overall persistence for the primary retention definition.
- Program baseline: persistence by program, modality, and student type.
- Course baseline: DFW rates, withdrawal patterns, assignment completion patterns.
- Service baseline: advising usage, tutoring usage, financial aid interactions.
Then add context that prevents misinterpretation. For example, early-term withdrawals may spike in programs with strict prerequisites—not because instruction is weaker but because placement and onboarding are misaligned. Student retention analytics should highlight these patterns without “ranking” departments unfairly.
Finally, use confidence and seasonality thinking. Comparing a small program across terms without acknowledging sample size can lead to overreaction. A strong student retention analytics practice includes:
- cohort size thresholds,
- multi-term moving averages,
- and clear notes for policy changes (curriculum redesign, new registration rules, new financial hold policies).
That’s how you keep retention math honest and decision-ready.
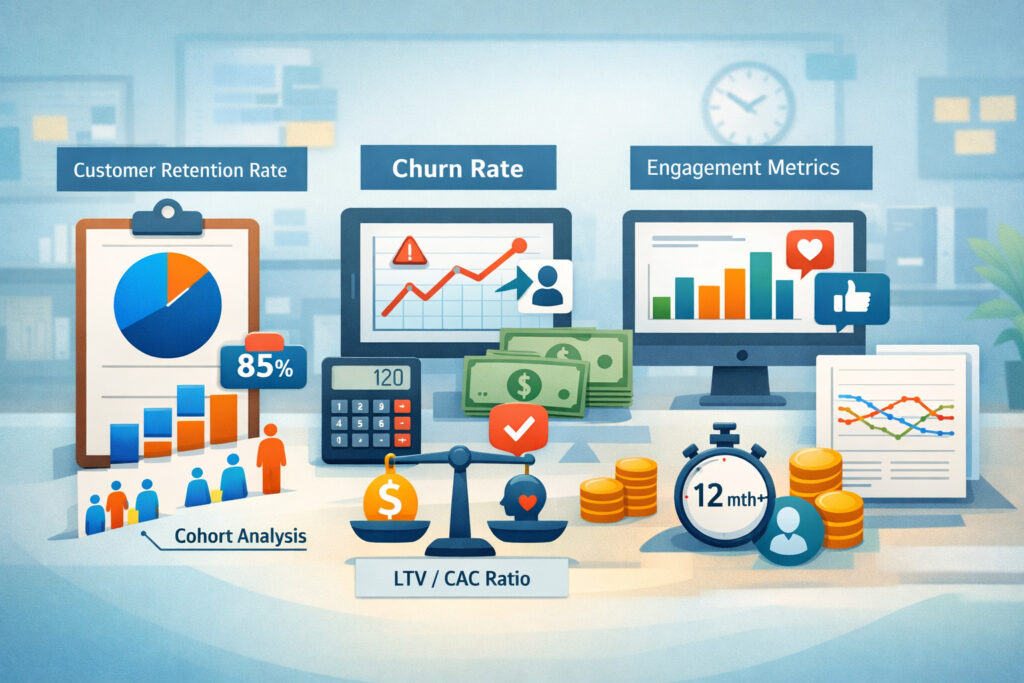
Choose metrics that predict retention, not just describe it

Descriptive metrics (like end-of-term GPA) explain what happened after it’s too late. Student retention analytics works best when it uses leading indicators that show risk while intervention is still possible.
The goal is not to track “everything,” but to track the smallest set of signals that reliably predicts persistence for your learner populations.
High-value leading indicators often include:
- Engagement frequency: logins, active days, time-on-task in learning tools.
- Academic pacing: missing assignments, late submissions, quiz attempts.
- Attendance and participation: presence, discussion activity, lab completion.
- Administrative friction: holds, incomplete documentation, missed advising check-ins.
- Financial stress signals: late payments, aid verification delays, sudden balance changes.
- Support-seeking behavior: tutoring bookings, help desk tickets, counseling appointments.
Combine these into a few composite measures that advisors and faculty can interpret quickly. For example, an “Academic Momentum Index” might include credits attempted vs. completed, week-by-week assignment completion, and attendance.
A “Platform Engagement Index” might include active days, assignment views, and tool usage events. Done well, these indices become the language of student retention analytics across teams.
Also include protective factors—not only risk signals. Students who attend office hours, complete orientation modules, and participate in peer communities often persist at higher rates. Student retention analytics should identify and replicate what works, not only flag what’s wrong.
One more metric category is essential: intervention measurement. Track whether outreach happened, whether the student responded, and what changed afterward (attendance improved, missing work decreased, hold resolved).
Student retention analytics becomes transformative when it proves which actions improve retention—not just which students are at risk.
Retention funnels and lifecycle stages
Retention is a lifecycle, and student retention analytics should model it as a funnel. Typical stages include:
- Inquiry → application → acceptance → registration
- Orientation → first-week engagement → early assessments
- Midterm momentum → support usage → course completion
- Re-enrollment → progression → completion
Each stage has different “drop-off” mechanisms. For example, registration drop-off often relates to administrative and financial barriers, while midterm drop-off might correlate with academic pacing.
Student retention analytics should show funnel conversion rates and “time-to-next-step” metrics. This helps teams focus on bottlenecks instead of spreading effort thinly.
Lifecycle modeling also enables tailored interventions. A student who misses orientation needs different support than a student who submits work but struggles conceptually. When student retention analytics aligns signals with lifecycle stages, it becomes easier to build precise, respectful outreach that students actually accept.
Build a modern data foundation for student retention analytics

Strong student retention analytics depend on a solid data foundation. If your data is delayed, inconsistent, or siloed, your models will be noisy and your staff will stop trusting dashboards. The foundation has four layers: sources, identity, events, and governance.
Common source systems include:
- Student information system (enrollment, credits, registration status)
- Learning management system (assignments, grades, activity)
- Advising and CRM tools (notes, outreach, appointments)
- Financial and billing systems (balances, holds, payment plans)
- Support services platforms (tutoring, counseling, accessibility services)
- Digital learning tools (courseware, video platforms, proctoring, library resources)
Next is identity resolution—ensuring one student has one consistent identifier across systems. This is often the hardest engineering step in student retention analytics, especially when learners have multiple emails, transfer records, or non-credit enrollments.
Then comes the event collection. Instead of importing only summary tables, modern student retention analytics uses event streams: “student viewed assignment,” “student submitted quiz,” “student booked appointment.”
Standards like Caliper Analytics exist to structure and exchange these learning activity events so data from tools can be used consistently for analytics and learner success.
Finally, governance ensures consistent definitions, secure access, and privacy controls. Without governance, student retention analytics becomes a patchwork of one-off reports.
A reliable architecture often includes a data warehouse or lakehouse, ELT pipelines, a semantic layer (metrics definitions), and BI dashboards. If you also need real-time alerts, add a streaming layer and notification workflows.
Instrumentation strategy: what to track and how to standardize it
Instrumentation is where student retention analytics becomes either powerful or chaotic. The rule is: track events that map to an action. If no one will respond to “video played for 3 seconds,” don’t track it. If advisors will respond to “two consecutive weeks with no LMS activity,” track it carefully.
Start with an event taxonomy:
- Authentication events (logins, failed logins)
- Course activity (views, submissions, attempts)
- Progress milestones (module completion, assessments passed)
- Support interactions (appointments, messages, service usage)
- Administrative actions (holds placed/cleared, forms submitted)
Then standardize naming, timestamps, and context fields (course_id, term_id, program_id). If you use Caliper or similar standards, you reduce vendor-specific complexity and make student retention analytics more portable across tools.
Be strict about data quality checks: missing timestamps, duplicate events, and inconsistent course identifiers will quietly destroy model accuracy. The most mature student retention analytics teams treat instrumentation as a product: versioned, documented, and tested.
Turn engagement data into actionable retention insights
Engagement is often misunderstood. High click counts don’t always mean learning, and low engagement can reflect accessibility barriers, work schedules, or offline study habits. Student retention analytics should interpret engagement in context and avoid simplistic “more clicks = better” assumptions.
A practical approach is multi-dimensional engagement scoring:
- Behavioral engagement: active days, assignment interactions, content views
- Academic engagement: submissions on time, quiz attempts, feedback usage
- Social engagement: discussion participation, peer collaboration
- Support engagement: tutoring, advising, office hours
Build a score that highlights change over time rather than absolute levels. For example, a student whose engagement drops sharply over two weeks may be at higher risk than a student who is consistently low but stable (especially in self-paced formats). Student retention analytics should prioritize trend detection and “change points.”
Also segment by modality. In-person learners may show lower LMS activity but high attendance. Online learners may show high LMS activity but still struggle. The best student retention analytics dashboards let teams compare engagement patterns within similar groups.
The biggest leap comes when engagement insights connect to actions: targeted messages, course nudges, tutoring invites, or advising check-ins. Measure whether engagement improves after outreach. This closes the loop and turns student retention analytics into a continuous improvement system.
Early-warning indicators that work in real operations
Early-warning indicators must be understandable and operational. A model can be statistically impressive and still fail if staff can’t act on it. The best early-warning indicators are:
- specific (“missed two major assignments”),
- timely (“within the last 7 days”),
- and paired with recommended actions (“offer tutoring + deadline planning”).
Many institutions use early warning systems that trigger alerts from multiple signals—academic activity, platform engagement, and administrative indicators—and route them to advisors quickly.
Real-world examples often emphasize integrated systems that monitor many risk indicators and prompt outreach before setbacks become withdrawals.
To keep alerts useful, apply thresholds and suppression logic:
- suppress duplicate alerts if outreach already happened,
- escalate if risk persists across weeks,
- and de-escalate when momentum returns.
Student retention analytics should also track alert fatigue metrics: how many alerts per advisor, response time, and resolution rate. If staff are overwhelmed, retention won’t improve.
Predictive models and early-alert systems for retention
Predictive modeling can add huge value, but only when it is transparent, monitored, and paired with human judgment. Student retention analytics models typically estimate the probability that a student will persist to the next term or complete a course. Inputs can include engagement trends, academic pacing, prior credits, financial holds, and support usage.
A common best practice is to start with interpretable models (logistic regression, gradient boosting with explainability) before jumping to complex deep learning. Advisors and faculty need to understand why a student is flagged.
Explainability features like top contributing factors (“missed assignments,” “no LMS activity,” “financial hold”) turn predictions into guidance.
Predictive systems often operate as early-warning systems that generate alerts at scale and trigger proactive outreach. Some institutions have long used integrated predictive engines that monitor many indicators and generate large volumes of alerts to prompt advisor contact.
But predictions should never be treated as destiny. Student retention analytics should present risk as probability with uncertainty, not a label. More importantly, measure whether flagged students improve because of support—not because they were predicted to fail.
Finally, monitor model drift. If curriculum changes, new LMS tools roll out, or advising processes shift, the model’s relationships change. Mature student retention analytics includes ongoing validation, retraining schedules, and fairness checks.
Avoiding bias and building trust in predictive retention analytics
Predictive student retention analytics can unintentionally amplify inequities if it uses proxies for disadvantage (like inconsistent access or financial variables) without careful governance. A responsible approach includes:
- feature review by a cross-functional committee,
- bias testing across student groups,
- and “human-in-the-loop” decision policies.
Build guardrails:
- Use predictions to offer support, not restrict opportunities.
- Avoid “black box” scoring with no explanations.
- Provide students transparency about data use and support intent.
Also invest in process trust. If advisors feel the system contradicts their lived experience, they will ignore it. If students feel surveilled, engagement may drop. Trust grows when student retention analytics is framed as support, not monitoring, and when the institution can show that interventions are helpful.
At a broader level, leading higher-ed technology discussions increasingly highlight AI’s growing role while emphasizing privacy and security as core priorities—an important context for how predictive student retention analytics will evolve.
Measure interventions: proving what improves retention
The most important question in student retention analytics is not “Who is at risk?” It’s “What works?” If you can’t measure the impact of interventions, you will keep running programs based on anecdotes.
Start by defining intervention categories:
- advising outreach (call/text/email cadence),
- tutoring referrals,
- deadline extensions or flexible pathways,
- financial counseling or payment plan support,
- academic coaching,
- peer mentoring,
- onboarding and orientation modules.
Then track intervention exposure:
- Was outreach attempted?
- Was contact made?
- Did the student engage?
- What support was delivered?
- What changed afterward?
Student retention analytics should use quasi-experimental techniques when randomized trials aren’t feasible:
- matched comparisons (similar students who did/didn’t receive support),
- difference-in-differences (before/after with control groups),
- and regression with covariates.
When feasible, run A/B tests for communications: message framing, timing, and channel. Small improvements in response rates can translate into meaningful retention gains.
Critically, measure short-term leading outcomes (assignment completion, attendance improvement) as well as the final retention outcome. This makes student retention analytics actionable quickly, rather than waiting months for term results.
Operational workflows that connect insights to action
Retention improves when analytics is embedded in workflows. A high-performing student retention analytics operation usually includes:
- weekly risk review meetings,
- advisor queues prioritized by risk + urgency,
- faculty nudges for course-level issues,
- and automatic routing rules (financial issues → financial counseling).
Build a closed-loop workflow:
- Analytics flags risk
- Staff outreach occurs
- Support is delivered
- Outcomes are recorded
- Analytics learns which interventions help
This loop is the difference between “data visibility” and “retention improvement.” Student retention analytics should make it easy for staff to log outcomes without adding burden. If logging is too hard, your intervention data will be incomplete and your conclusions will be weak.
Privacy, compliance, and ethical use of student retention analytics
Student retention analytics deals with sensitive educational records and behavioral data. Privacy is not a barrier to analytics—it’s the foundation that makes analytics sustainable. The baseline legal environment includes federal student privacy protections (FERPA), which establish rules for protecting student education records and privacy.
A practical privacy-first approach includes:
- data minimization: collect only what you need for retention decisions,
- purpose limitation: use data for support, not punitive evaluation,
- access control: least-privilege permissions based on role,
- retention limits: delete or archive data on a defined schedule,
- security controls: encryption, audit logs, and vendor risk reviews.
Student retention analytics programs should have a clear student-facing explanation: what data is collected, how it’s used, who can access it, and how students can ask questions. This transparency reduces fear and increases engagement.
Ethics also includes respecting autonomy. Not every student wants outreach. Offer opt-outs where possible and design communications that feel supportive, not coercive. The best student retention analytics programs are built with student voices—through advisory councils or feedback loops.
Finally, ensure you’re not building a “surveillance culture.” Tracking every click is rarely necessary. Measure what helps support and success. This keeps student retention analytics aligned with education values and reduces reputational risk.
Governance models that keep analytics healthy long-term
Governance makes student retention analytics durable. Without it, definitions drift, data access expands without oversight, and models get deployed without validation. A simple governance model includes:
- a data governance council (registrar, IT, advising, faculty, student services),
- a metrics glossary owner,
- a model review process,
- and a privacy/security review step for new data sources.
Document “acceptable use” policies for retention analytics:
- who can see risk scores,
- how scores can be used,
- and what actions are prohibited (e.g., denying enrollment opportunities based on risk).
Also create an incident process: if a data issue or misclassification occurs, staff should know how to report it and how to correct records. Trust in student retention analytics grows when the institution can admit mistakes and fix them quickly.
Future trends and predictions for student retention analytics
Student retention analytics is moving toward faster signals, more personalization, and more automation—while also facing stronger privacy expectations. Several trends are likely to define the next few years.
1) Real-time retention operations: Institutions will increasingly shift from end-of-term reports to near-real-time dashboards and alerts. Event standards like Caliper make it easier to stream learning activity data from tools into analytics pipelines.
2) AI copilots for advising and instruction: AI will help summarize student histories, draft outreach messages, and recommend next-best actions. However, higher-ed technology outlooks emphasize that AI growth must be paired with stronger data privacy and security practices.
3) More focus on equity and fairness auditing: Predictive student retention analytics will be expected to include fairness testing, explainability, and documented safeguards. Stakeholders will demand proof that models improve outcomes without discriminatory effects.
4) Integrated student experience analytics: Retention will be measured across the full student journey—from onboarding and registration to career services. Student retention analytics will merge learning data with service data to identify friction points outside the classroom.
5) Stronger vendor accountability: Institutions will require clearer data contracts, audit rights, and security assurances. Privacy guidance and compliance expectations will continue to shape procurement decisions, pushing vendors to offer better controls and transparency.
FAQs
Q.1: What is the best “starter” metric set for student retention analytics?
Answer: A strong starter set for student retention analytics includes a small number of leading indicators and one retention outcome definition.
Start with term-to-term persistence as the outcome, then track leading indicators weekly: (1) attendance or course presence, (2) missing assignments, (3) LMS active days, (4) unresolved holds, and (5) advising contact status.
Why this set works is that it spans academic, behavioral, and administrative domains. Many early retention problems are not purely academic; they’re friction problems. Student retention analytics becomes immediately useful when it shows, for example, that a large share of non-returners had unresolved holds or never completed onboarding tasks.
Also choose one or two protective factor metrics: orientation completion and tutoring/advising engagement. This helps teams focus on expanding what works rather than only managing risk.
Keep the metrics simple enough that staff can act without interpretation debates. Once you demonstrate value—faster outreach, better student responses, improved short-term momentum—you can expand into program-level models and more sophisticated engagement scoring.
Q.2: How often should student retention analytics dashboards update?
Answer: The ideal update frequency depends on the decisions you’re enabling. For advising queues and early-warning workflows, student retention analytics should update at least daily during active terms, and sometimes more frequently if your systems allow it. Weekly updates can be sufficient for strategic reporting, but they are often too slow for operational support.
If daily updates aren’t possible, focus on a reliable cadence that staff can trust. A “perfect” real-time dashboard that breaks or lags will be ignored.
Many teams start with nightly batch updates from the LMS and SIS, then add streaming events later as maturity grows. Standards designed for collecting learning activity data at scale can support more timely analytics as your ecosystem evolves.
Most importantly, align updates with action windows. If you want faculty to intervene before a major assignment deadline, your student retention analytics must refresh early enough to catch missed work and enable a message in time.
Q.3: Can predictive student retention analytics replace advisor judgment?
Answer: No—and it shouldn’t try to. Predictive student retention analytics is best used as decision support: it helps advisors prioritize outreach, identify hidden risk patterns, and surface relevant context.
But advisors understand nuances that data cannot capture: personal circumstances, motivation signals from conversations, and situational constraints.
A healthy practice is “human-in-the-loop” decision-making. The system proposes risk and contributing factors, and the advisor confirms, overrides, or refines the outreach plan. This approach also improves trust and reduces harm from model errors.
Predictive systems are commonly used as part of early-warning operations that generate alerts to prompt proactive contact, but the value comes from the people and the support process—not from the score alone.
If you want predictions to help, invest just as much in workflow design, training, and intervention measurement as you do in modeling. Student retention analytics succeeds when predictions lead to meaningful support, not when they become labels.
Q.4: How do we stay compliant while using student retention analytics?
Answer: Compliance starts with understanding that educational records and related data require strong privacy protections, role-based access, and clear purpose limitation. Federal student privacy rules (FERPA) establish requirements around protecting student education records and privacy.
In practice, compliance for student retention analytics includes:
- limiting access to staff who need the data for student support,
- minimizing data collection to what supports retention decisions,
- securing vendor contracts with clear data use and retention terms,
- encrypting sensitive data and maintaining audit logs,
- and communicating transparently with students about how analytics supports success.
Also create a governance process for adding new data sources. Each new source should pass a privacy review: what is collected, how it improves retention, and what the risks are. When privacy is built-in, student retention analytics becomes more sustainable and earns broader campus support.
Q.5: What’s the biggest mistake institutions make with student retention analytics?
Answer: The biggest mistake is building dashboards without an action system. Student retention analytics can look impressive while delivering little value if it doesn’t change outreach, course support, or service design.
Another common mistake is measuring too late—relying on end-of-term GPA or final grades as “risk signals,” when the real opportunity is earlier.
A close runner-up has unclear definitions. If “retention” means one thing to leadership and another to advising, every conversation becomes a debate. Establishing a shared glossary and stable cohorts is essential.
Finally, over-collecting data can backfire. If analytics feels like surveillance, students may disengage and staff may resist. Focus on signals that enable support, standardize events where possible, and align with privacy expectations from the start. This balance is where student retention analytics becomes both effective and trusted.
Conclusion
Measuring student retention with software analytics is ultimately about building a closed-loop system: detect risk early, deliver support quickly, and learn what works.
Student retention analytics becomes powerful when it is defined clearly (cohorts and retention outcomes), grounded in leading indicators (momentum and engagement trends), supported by a modern data foundation (standardized events and identity resolution), and operationalized through workflows (advisor queues, faculty nudges, and service routing).
The institutions that improve retention most consistently are the ones that treat analytics as a student success product—not a reporting project. They invest in governance, privacy, and trust alongside technology.
They measure interventions, not just risk. And they continuously refine signals as programs and learning tools change, using standards that enable learning data to be collected and exchanged at scale.